← All modules
Reports & analytics
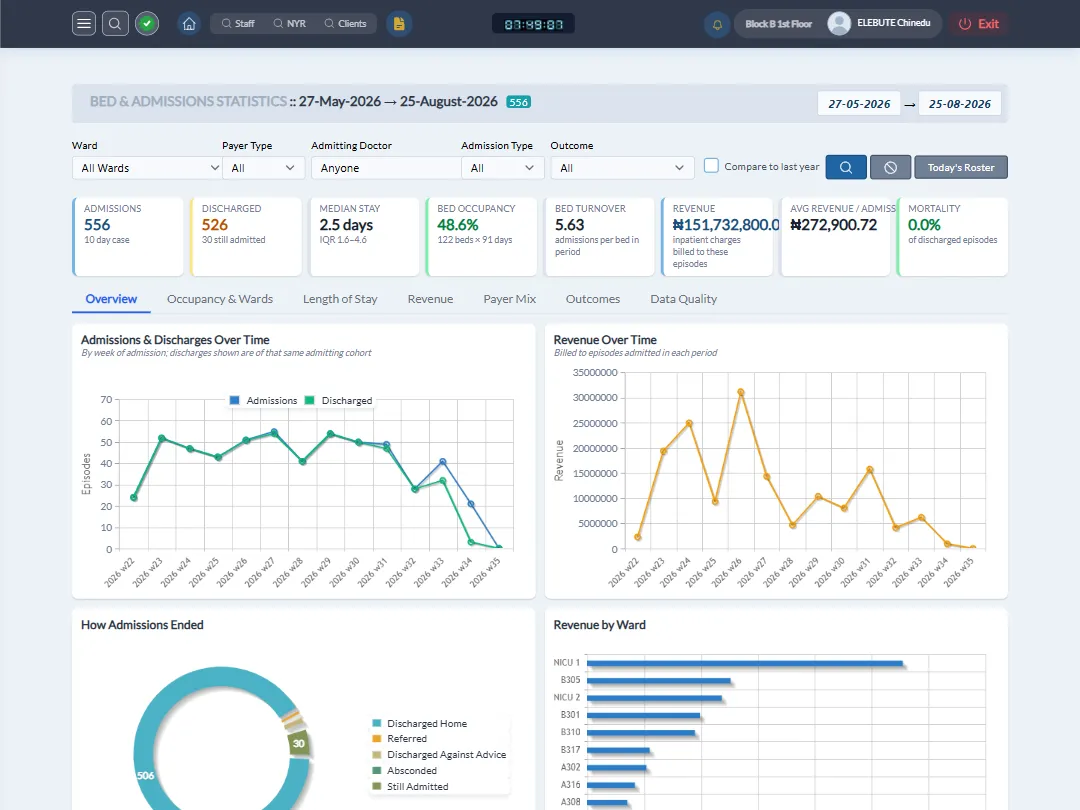
Graphical summaries of visits, admissions, bills and receipts, sliced by day, week, month or quarter.
- Bills-versus-receipts and admissions trend charts, updated live
- Drill down from yearly to monthly to daily figures in a click
- Bar, line and other chart types for the same underlying data
- Pre-built reports for the metrics management asks about most
Management needs answers, not spreadsheets. SwiftPractice’s reporting tools turn the same transaction data used for billing into charts that update as the day happens.
What’s included
Graphs cover client visits, procedures, total bills, total receipts, bills-versus-receipts, and admissions, viewable by day, week, month or quarter and switchable between bar and line chart types. Any chart can be drilled into: a monthly total expands into its daily breakdown without leaving the page.
See reports & analytics in action.
A short walkthrough tailored to your departments, no obligation.